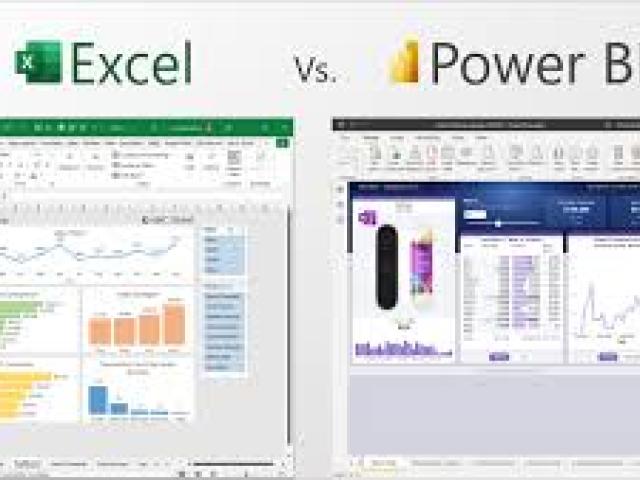
An Excel for Business Intelligence (BI) course teaches you to transform raw data into interactive, visual dashboards and reports using Excel's features like PivotTables, PivotCharts, conditional formatting, and interactive controls such as Slicers. These courses are for professionals in finance, marketing, and management who want to improve performance monitoring, track Key Performance Indicators (KPIs), and make informed, data-driven decisions by presenting complex data in an accessible and actionable format


